
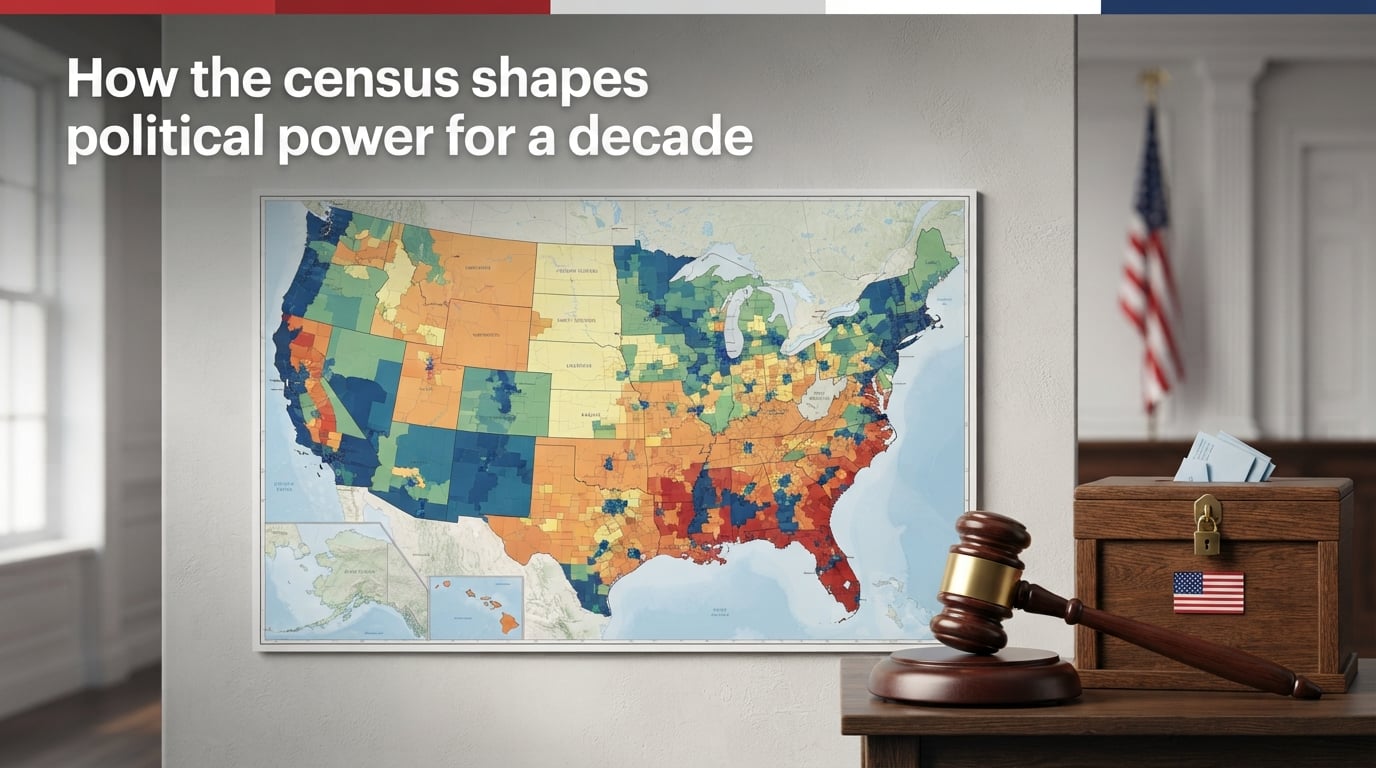
Every ten years, the United States conducts a count of every person living within its borders. That single count, the decennial census, decides how the 435 seats in the U.S. House of Representatives are split among the 50 states, how Electoral College votes are distributed, and how roughly $1.5 trillion in federal funds are routed each year. If you have ever wondered how the census shapes political power for a decade, the short answer is this: the population numbers collected in one April ripple through every election, every district map, and every federal dollar for the next ten years.
In this guide, I will walk you through exactly what apportionment is, how the math works, which states gained and lost seats after the most recent census, and why participating in the count matters for your community. Whether you are a voter, an activist, or simply a curious citizen, you will leave with a clear picture of how a single head count redraws the political map.
Table of Contents
What Is Congressional Apportionment?
Congressional apportionment is the process of dividing the 435 voting seats in the U.S. House of Representatives among the 50 states based on each state’s population. The Constitution requires this division to happen every ten years, immediately after the decennial census, so that political representation in the lower chamber tracks population shifts.
The number 435 is fixed. It was set by the Reapportionment Act of 1929, which capped the size of the House to prevent it from ballooning as the country grew. Every state is guaranteed at least one seat regardless of population, and the remaining 385 seats are handed out using a formula that favors states with larger populations.
The seat cap is a tradeoff. It keeps the House manageable in size and lets smaller states keep their voice. But it also means that as your state’s share of the national population grows, your influence in Washington does not grow proportionally. The 435 ceiling is why a state with 40 million people has 52 representatives while a state with 1 million still has one.
The Decennial Census: Counting Every Resident Once Every Ten Years
The decennial census is the official count of every person living in the United States, conducted every ten years as required by Article I, Section 2 of the Constitution. The first census took place in 1790, and the count has happened in every year ending in zero since then, including the upcoming 2030 count.
Three things make the census unique in American government. First, it counts residents, not citizens or voters, because the Constitution bases representation on the whole number of persons. Second, every household is legally required to respond. Third, the Census Bureau protects individual responses for 72 years, so your data is never used against you.
The census matters because the numbers it collects drive three huge downstream processes: apportionment of House seats, redistricting within states, and allocation of federal program funding. An undercount of just 1% in a state can cost that state a congressional seat and millions of dollars over the decade that follows.
How the 435 House Seats Get Distributed
The 435 House seats are distributed using a formula called the method of equal proportions, also known as the Huntington-Hill method. This method has been the official apportionment math since 1941. The formula gives each state a priority score for each possible seat, ranks those scores nationwide, and awards seats to the 435 highest scores.
The math works like this. For every state, the Bureau calculates a score for one seat, two seats, three seats, and so on using the formula: state population divided by the square root of n times (n minus 1). All those scores are pooled together, and the 435 highest scores win.
This method ensures that no state gets more seats than its fair share. It also prevents larger states from squeezing smaller ones out of representation.
Earlier methods, like the method of major fractions used between 1850 and 1900, gave different states different advantages depending on rounding rules. Congress has changed the formula seven times since 1790, always looking for a system that is both mathematically fair and politically stable. The current method has survived more than 80 years because it produces results that both major parties tend to accept.
States That Gained and Lost Seats After the 2020 Census
The 2020 census produced the largest reshuffling of political power in decades, driven by population growth in the South and West and stagnation or decline across the Northeast and Midwest. Six states gained seats and seven states lost seats, shifting dozens of House districts from one region to another.
The biggest winners were Texas, which added two seats and now holds 38, and Florida, which also added two seats and now holds 28. Colorado, Oregon, Montana, and North Carolina each gained one seat. These gains reflect rapid population growth driven by migration from other states, climate-driven relocations, and younger family households moving south for jobs and lower costs of living.
The biggest losers were California, New York, and Illinois, each shedding one seat. Pennsylvania, Ohio, Michigan, and West Virginia also each lost a seat. Most of these states lost population through domestic out-migration, lower birth rates, and slower immigration from abroad.
The net effect is that political power is slowly migrating from the Rust Belt to the Sun Belt, a trend that has held across three straight census cycles.
From Apportionment to Redistricting
Apportionment tells each state how many House seats it gets. Redistricting is the next step, where each state draws the actual geographic boundaries for those seats. The two processes are related but separate, and both depend entirely on the census data released in the previous year.
Once a state knows it has, say, 38 House seats, its legislature or independent commission must redraw 38 district boundaries so that each one contains roughly the same number of people. Federal law requires districts to be compact, contiguous, and equal in population. The Voting Rights Act also requires that minority communities have a fair chance to elect candidates of their choice.
The party in power at the state level usually controls the redistricting process, which is why the same census can produce wildly different maps. Two states with identical population patterns can end up with very different political outcomes depending on whether the map is drawn by a Republican legislature, a Democratic legislature, or an independent citizens’ commission. This is the step where raw census data turns into actual electoral power.
Beyond the House: Electoral College and Federal Funding
Census apportionment does not just affect the House of Representatives. Because the Electoral College is tied to congressional representation, every shift in House seats also shifts the number of electoral votes each state receives for the next three presidential elections.
Texas gained two House seats after the 2020 census, which automatically added two electoral votes. California lost one House seat, which means one fewer electoral vote. These changes do not always decide presidential elections, but in close races, a single electoral vote in a swing state can determine the outcome. The census quietly sets the table for the next decade of presidential politics.
Census data also drives federal funding. Programs like Medicaid, SNAP, highway planning, Title I school funding, and community development block grants use census-derived formulas to distribute money. Analysts estimate that more than $1.5 trillion in federal funding each year is allocated based on the most recent census count.
An undercount of even a few thousand people can cost a city or state hundreds of millions of dollars in lost services.
The Census-to-Representation Timeline
The full census-to-redistricting cycle takes about two and a half years, and then the resulting maps stay in force for the rest of the decade. Here is the typical timeline:
April 1 of the census year: Census Day, the reference date for who is counted and where.
Spring to fall: Households respond by mail, phone, or in person with enumerator visits.
December 31: The Census Bureau delivers population totals to the President.
January of the following year: The Clerk of the House announces how the 435 seats are apportioned.
March through August: More detailed demographic data is released for redistricting.
Two years after Census Day: All states must finish redrawing their districts in time for the next congressional election.
Years 3 through 10: The maps, the electoral votes, and the funding formulas all stay frozen until the next census.
That last point is the heart of the matter. Once the maps are drawn, they shape every congressional election, every state legislative election, and every federal funding decision for the next decade. A 30-minute census response in April can determine who represents you in Washington for the next ten years.
Why Census Politics Matter for the Next Decade
So how does the census shape political power for a decade? It works in three big ways: it sets the number of House seats and Electoral College votes your state receives, it determines who draws your district lines, and it controls the flow of federal dollars into your community. All three of those factors stay locked in for ten full years until the next census resets them.
If you want to protect your representation, the most important thing you can do is respond to the census when it arrives. Every household that goes uncounted weakens the political voice of the community. If you want to dig deeper, the U.S. Census Bureau publishes every apportionment calculation and historical data set going back to 1790, so you can verify how your state’s share has changed over time.
The framers of the Constitution understood that population shifts should reshape political power, which is why they built a fresh count into the foundation of the republic. Two hundred and thirty years later, that same principle still decides who speaks for you in Congress, who gets your state’s electoral votes, and how federal dollars reach your neighborhood. That is why a single April count in 2026 will shape American politics for the entire decade that follows.
Frequently Asked Questions
What is congressional apportionment?
Congressional apportionment is the process of distributing the 435 voting seats in the U.S. House of Representatives among the 50 states based on population data collected in the decennial census. Every state is guaranteed at least one seat, and the remaining seats are assigned using a mathematical formula.
How is the census used to determine representation in Congress?
The Census Bureau counts every resident every ten years. That population data is sent to Congress, where a formula called the method of equal proportions divides the 435 House seats among the states. States with more population gain seats, and states that lose population can lose seats.
How often does apportionment of the House of Representatives occur?
Apportionment happens once every ten years, immediately after the decennial census. The next apportionment will follow the 2030 census and will govern House representation through 2040.
What is the difference between apportionment and redistricting?
Apportionment decides how many House seats each state gets. Redistricting decides where the boundaries of those seats are drawn within the state. Both depend on census data, but they are separate processes controlled by different actors.
How does the census affect the Electoral College?
Each state gets one Electoral College vote for every House seat plus two for its Senate seats. When the census changes how many House seats a state has, it also changes how many electoral votes that state gets for the next three presidential elections.
Why is the census important to the government?
The census drives three core government functions: it sets the size of each state’s congressional delegation, it funds the redistricting process, and it is used to allocate more than $1.5 trillion in federal program funding each year. Without an accurate count, representation and resources both suffer.
What happens if my state is undercounted in the census?
An undercounted state can lose a congressional seat, lose electoral votes, and lose federal funding for schools, hospitals, and infrastructure. The undercounted communities also lose political power for the full ten years until the next census.